Debugger
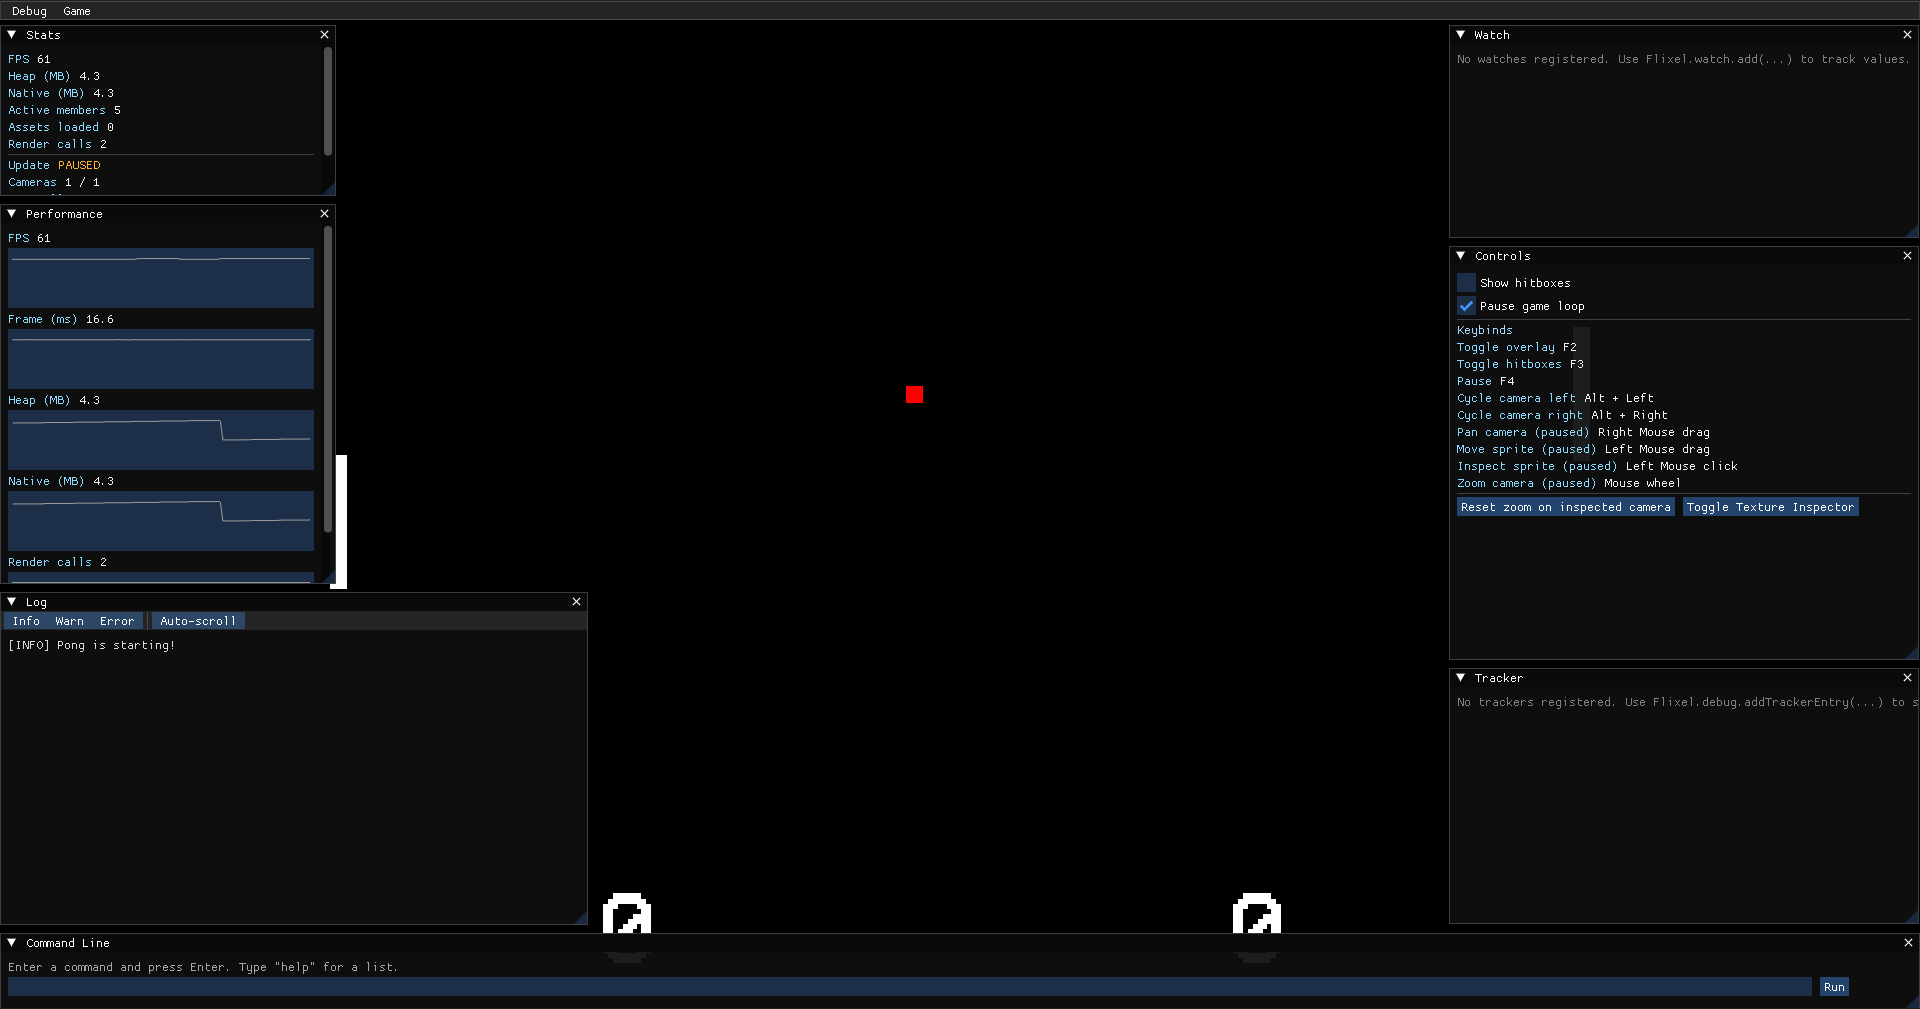
FlixelGDX ships a full-featured in-game debugger powered by Dear ImGui. On desktop (LWJGL3) it gives you a floating HUD with multiple dockable panels that you can show, hide, resize, and rearrange at will — all without restarting your game.
The ImGui-based overlay is only available in the LWJGL3 backend. The core module includes a lightweight
headless overlay for other backends (TeaVM, Android) that handles hitbox drawing and command dispatch but has
no windowed UI. If you need a full UI on another backend you can implement FlixelDebugOverlay yourself.
Enabling the debugger
Pass FlixelRuntimeMode.DEBUG when launching:
- Java
- Kotlin
public static void main(String[] args) {
  FlixelLwjgl3Launcher.launch(new MyGame(), FlixelRuntimeMode.DEBUG);
}
fun main() {
  FlixelLwjgl3Launcher.launch(MyGame(), FlixelRuntimeMode.DEBUG)
}
When DEBUG mode is active, the ImGui overlay is created and can be toggled at any time. In RELEASE mode the
overlay is never created, so there is zero per-frame cost in shipped builds.
Flixel.debug and Flixel.watch are always availableThe manager objects (Flixel.debug and Flixel.watch) exist in every build, debug or release — they are
never null. What changes is whether a visual overlay is attached. Outside of DEBUG mode their methods become
harmless no-ops: a registered command or watch entry simply has no window to appear in, and the suppliers you
register are never evaluated. This means you can call them unconditionally without null-checks.
Showing and hiding panels
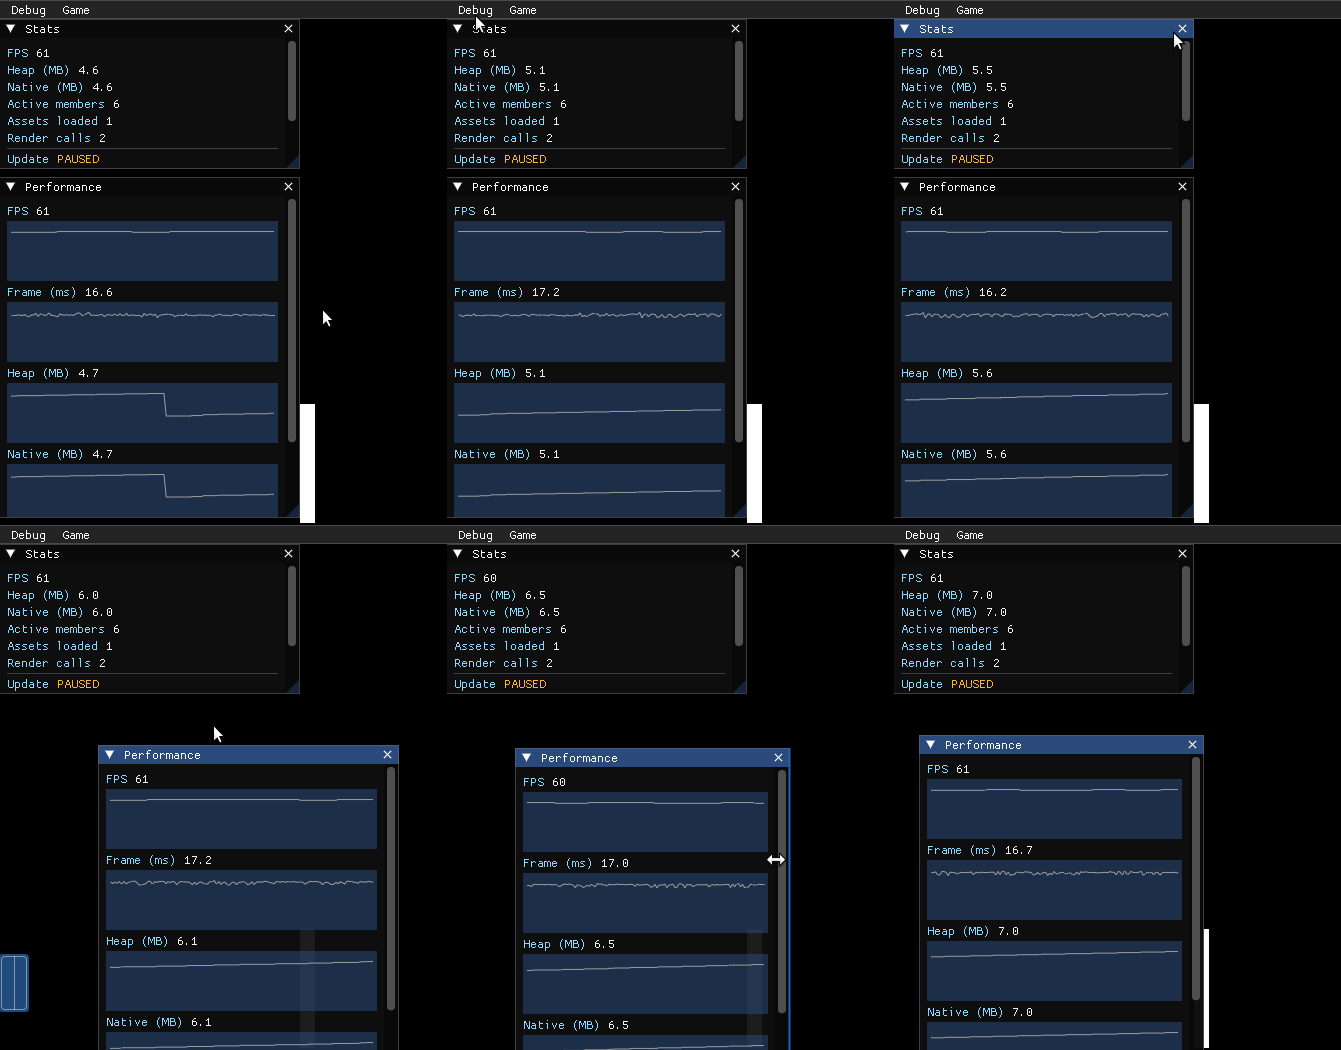
The overlay is split into several floating panels, each documented below. You arrange them however you like: drag a panel by its title bar, resize it from any edge, and the layout sticks until you reset it.
There is a menu bar pinned to the top of the screen with two menus:
- Debug — a checkbox for each panel (Stats, Performance, Controls, Tracker, Watch, Log, Command Line, Texture Inspector), plus Reset Layout (snaps every panel back to its default position) and Hide Overlay.
- Game — quick toggles for Show Hitboxes and Pause Game, and a Reset State button.
Pressing the overlay toggle key (F2 by default) hides or shows the entire overlay at once.
The overlay windows
Stats window
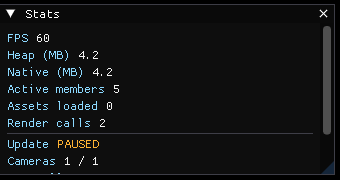
The Stats window is your game's dashboard — the speedometer and fuel gauge you glance at to confirm everything is healthy. It shows these rows:
| Row | What it means |
|---|---|
| FPS | Frames per second, as reported by libGDX. Your target is usually 60. |
| Heap (MB) | Java heap memory currently in use. If this climbs forever, you are leaking objects. |
| Native (MB) | Off-heap memory used by GL textures and audio buffers (hidden if the platform reports zero). |
| Active members | How many living objects the current state is updating and drawing right now. |
| Assets loaded | Number of assets currently held by Flixel.assets. |
| Render calls | How many draw batches were flushed to the GPU last frame. Fewer is faster. |
Below those, a divider separates two extra readouts:
- Update —
RUNNINGorPAUSED, so you always know whether the game loop is frozen. - Cameras — which camera is selected for inspection (
2 / 3means the second of three), plus that camera'sScroll X,Scroll Y, andZoom.
If you are coming from raw libGDX, you are used to SpriteBatch flushing the moment you bind a different texture
— so keeping your render call count low means manually packing every sprite onto a shared atlas and carefully
controlling draw order. FlixelGDX does not work that way.
FlixelBatch and FlixelSpriteBatch are texture-bind-aware: they assign each unique texture to an OpenGL texture
unit and record the slot index per vertex, so a single draw call can render sprites from up to 32 different
textures at once on desktop (fewer on mobile or weaker hardware, determined at runtime from GL_MAX_TEXTURE_IMAGE_UNITS).
With raw SpriteBatch every texture switch is a flush; here, the batch only flushes when all slots are occupied by
a new unseen texture, the vertex buffer fills up, blend state changes, or end() is called. For most scenes this
is a significant reduction in render calls.
That said, render calls still matter. The framework does a lot of the heavy lifting, but it cannot help if your scene has many more distinct textures than available slots, frequent shader or blend-state changes, or particle effects that force mid-frame flushes. Watch this number as your scene grows — a sudden spike is usually a sign that something is forcing more flushes than expected.
Performance window
Where the Stats window shows you this instant, the Performance window shows you history — like a heart-rate monitor instead of a single pulse reading. It draws several rolling line graphs, one stacked above the next, each labeled with its latest value:
- FPS — frames per second over time.
- Frame (ms) — how many milliseconds each frame took. Spikes here are the stutters your players feel.
- Heap (MB) — Java heap usage. A repeating sawtooth (climb, then sudden drop) is the garbage collector at work.
- Native (MB) — native memory, shown only when the platform reports a non-zero value. Note that this value might be the same as the heap on desktop, as neither libGDX nor FlixelGDX provide a reliable way to determine native memory.
- Render calls — draw batches per frame.
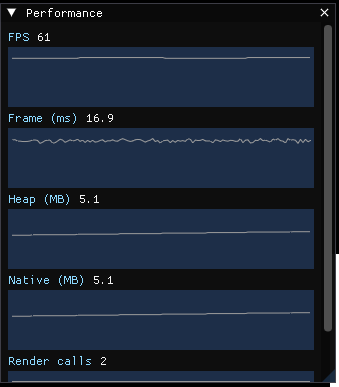
The buffers are sampled continuously while the game runs in debug mode, even while this window is closed, so opening it mid-session shows real history instead of an empty graph.
A flat line is good — it means every frame took about the same amount of time. A tall spike means one frame took much longer than the rest, which the player sees as a hitch. If the spikes line up with sawtooth drops on the Heap graph, you are allocating too much memory in your update loop (see Best Practices).
Log window
The Log window is your game's running diary. It streams everything that passes through FlixelLogger — the
same logger behind Flixel.info, Flixel.warn, and Flixel.error — so you never need a System.out.println
again. Messages are color-coded by severity:
- White — INFO (normal messages)
- Yellow — WARN (something looks off, but the game keeps going)
- Red — ERROR (something actually went wrong)
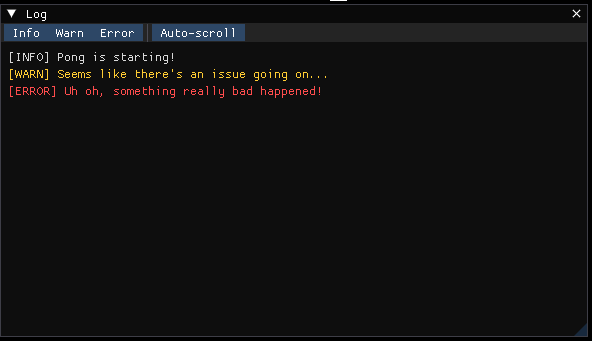
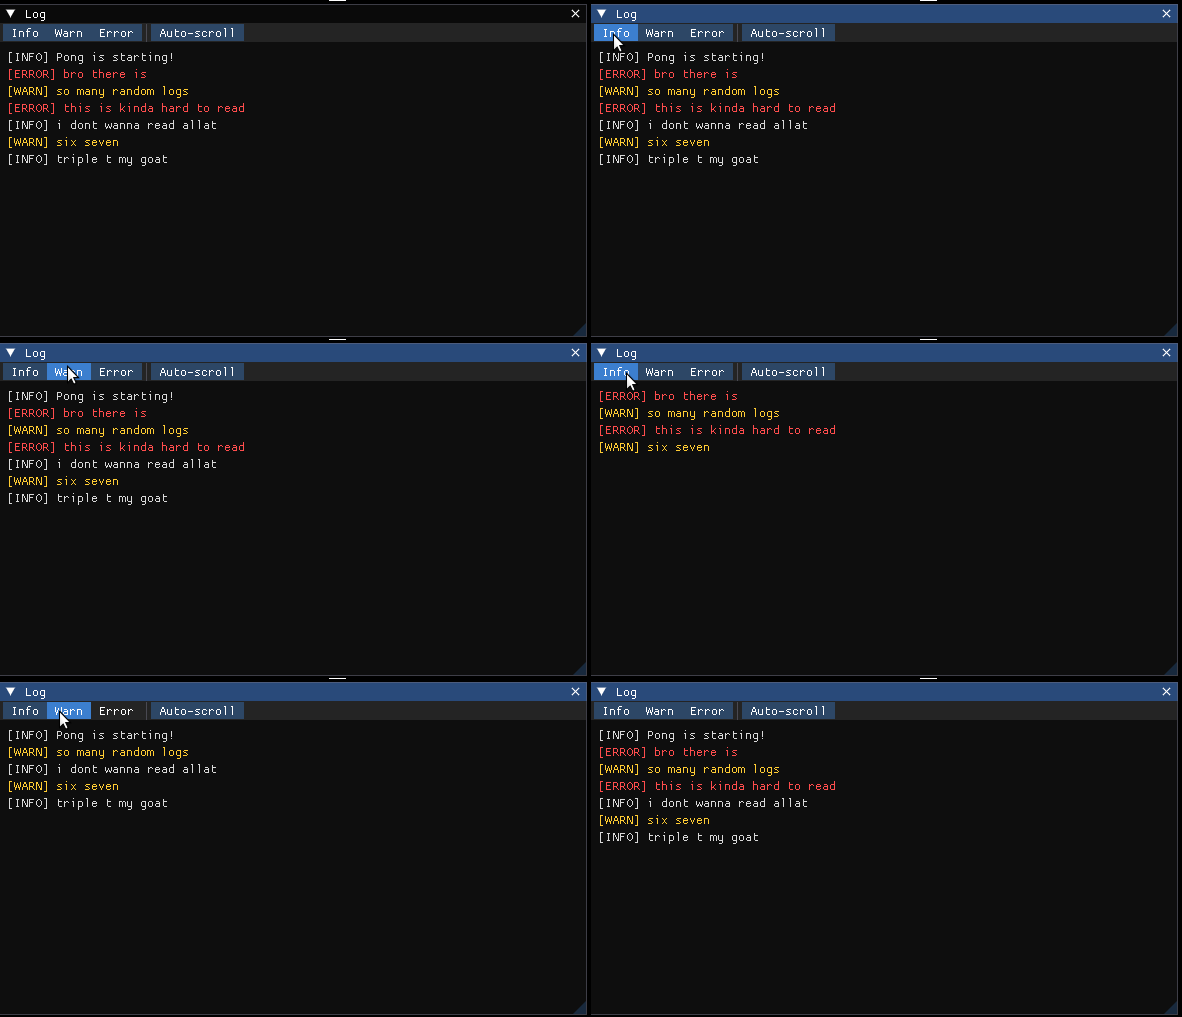
A menu bar across the top lets you toggle each level on or off (handy for hiding chatty INFO lines while you hunt an error) and flip Auto-scroll, which keeps the newest line in view at the bottom. The logger keeps a capped number of recent lines and trims the oldest, so the window never grows without bound.
Watch window
The Watch window shows live name → value pairs that you register from your game code, laid out as a
two-column table. It is perfect for tracking moving values — a sprite's position, a velocity, an AI state — without
spamming the Log.
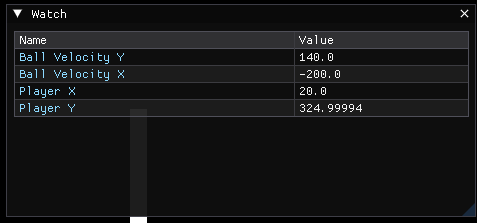
Think of it as a row of labeled gauges you bolt onto your game: you decide what each gauge measures, and the debugger keeps the needle updated for you.
- Java
- Kotlin
// Register any supplier. It is re-evaluated several times a second while the overlay is visible.
Flixel.watch.add("Player X", () -> player.getX());
Flixel.watch.add("Player Y", () -> player.getY());
Flixel.watch.add("Speed", () -> Math.hypot(player.getVelocityX(), player.getVelocityY()));

// Convenience helper: adds a "Mouse" entry with the cursor's position.
Flixel.watch.addMouse();
// Register any supplier. It is re-evaluated several times a second while the overlay is visible.
Flixel.watch.add("Player X", FloatSupplier { player.x })
Flixel.watch.add("Player Y", FloatSupplier { player.y })
Flixel.watch.add("Speed", DoubleSupplier { Math.hypot(player.velocityX.toDouble(), player.velocityY.toDouble()) })

// Convenience helper: adds a "Mouse" entry with the cursor's position.
Flixel.watch.addMouse()
The suppliers run only while the overlay is visible, so a hidden overlay costs nothing. If a supplier throws
(for example, reading player.getX() when player is still null), the panel catches it and shows <error>
instead of crashing your game.
Call Flixel.watch.remove("Player X") to remove a single entry, or Flixel.watch.clear() (or the built-in
watch.clear command) to clear all of them.
Controls window
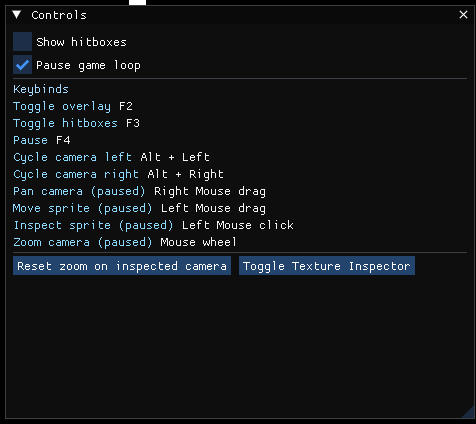
The Controls window is a cheat-sheet and a remote control in one. At the top are two checkboxes:
- Show hitboxes — draws each object's bounding box (same as the F3 key).
- Pause game loop — freezes and unfreezes the game (same as the F4 key).
Below a divider, a Keybinds list reminds you of every debug control and what it does (toggle overlay, toggle hitboxes, pause, cycle cameras, pan/zoom/move with the mouse), so you never have to memorize them. At the bottom are two buttons: Reset zoom on inspected camera (snaps the inspected camera back to 1x) and Toggle Texture Inspector.
Tracker window
The Tracker window shows custom, named groups of live values that you register from your game code. Each
group has a header you can click to collapse or expand, like the foldable sections of a settings menu, and inside
it lists a name -> value table just like the Watch panel. The difference from the Watch panel is grouping: a
Watch entry is a single loose value, while a Tracker entry bundles several related values under one heading.
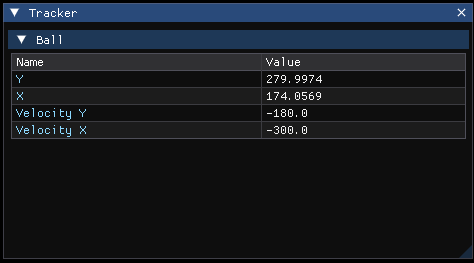
Register a group by subclassing FlixelDebugTrackerEntry (from org.flixelgdx.debug) and adding it to
Flixel.debug. Its getTrackedValues() returns an ObjectMap of label -> value pairs (libGDX's allocation-light
map), pulled fresh on each refresh so the group always reflects the current state. This is the place for tidy,
always-current dumps — an inventory, a state machine, a table of spawn weights — that would be unreadable as a
flood of Log lines.
Hold one ObjectMap as a field and only update its values each frame (as below), rather than allocating a new map.
Keep the same keys between frames so the row order stays stable. Because getTrackedValues() only runs while the
overlay is visible (and only a few times a second), this never touches your real game loop.
- Java
- Kotlin
public class PlayerStatusEntry extends FlixelDebugTrackerEntry {

  // Object reference we want to track.
  private Player player;

  // Reuse one map; we only update its values each frame, never reallocate it.
  private final ObjectMap<String, String> values = new ObjectMap<>();

  public PlayerStatusEntry(Player player) {
    super("Player status"); // The collapsible header shown in the Tracker panel.
    this.player = player;
  }

  @Override
  public ObjectMap<String, String> getTrackedValues() {
    values.put("HP", String.valueOf(player.getHp()));
    values.put("Ammo", String.valueOf(player.getAmmo()));
    return values;
  }
}

// Register it once (for example in your state's create()):
Flixel.debug.addTrackerEntry(new PlayerStatusEntry());
// "Player status" is the collapsible header shown in the Tracker panel.
class PlayerStatusEntry(val player: Player) : FlixelDebugTrackerEntry("Player status") {

  // Reuse one map; we only update its values each frame, never reallocate it.
  private val values = ObjectMap<String, String>()

  override fun getTrackedValues(): ObjectMap<String, String> {
    values.put("HP", player.hp.toString())
    values.put("Ammo", player.ammo.toString())
    return values
  }
}

// Register it once (for example in your state's create()):
Flixel.debug.addTrackerEntry(PlayerStatusEntry())
The Tracker is shown by default, docked under the Controls panel. When no entries are registered it stays visible with a hint (just like the Watch panel), so you always know where to find it.
Texture Inspector window
The Texture Inspector lets you look at the actual texture behind a sprite — the whole sheet, not just the frame currently on screen, so you can confirm an atlas loaded correctly. It is hidden by default; open it from the Debug menu or the Toggle Texture Inspector button in the Controls window.
To inspect a sprite:
- Make sure the overlay is visible and the game is paused (F4 by default). Picking only works while paused.
- Left-click any sprite in your game window. The object under the cursor becomes the "inspected sprite," and the panel fills in with its details.
The panel shows the sprite's Type, Position, Size, and Texture dimensions, then renders the texture itself. Drag the Zoom slider (0.25x to 8x) to scale the preview, and use the scrollbars to pan around a large sheet.
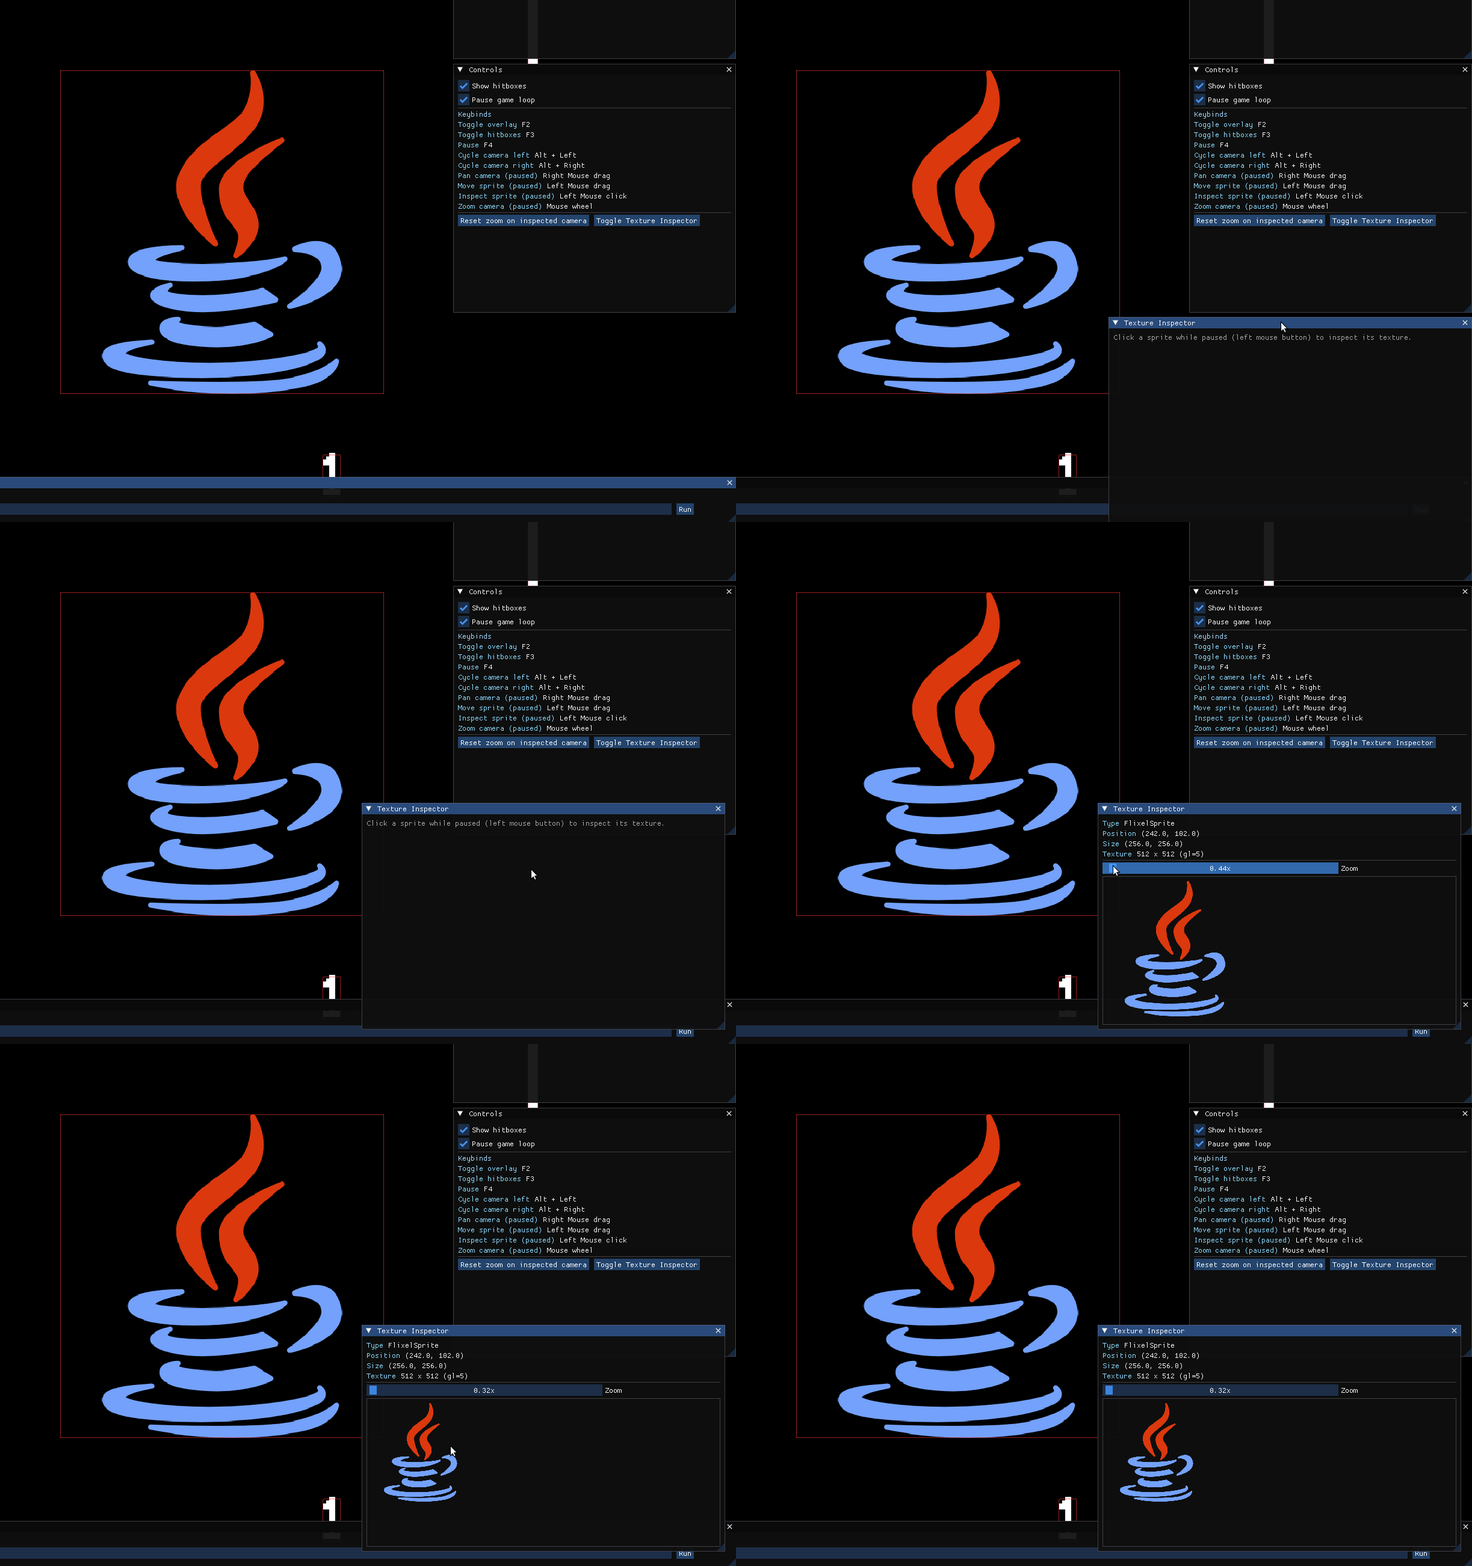
While a sprite is selected and the game is paused, you can also drag it with the mouse to reposition it in the world — handy for eyeballing hitbox alignment or nudging something into place without editing code. Positions you change this way are real, so undo them before unpausing if you did not mean to keep them.
Command Line window
The Command Line window is an in-game terminal. Type a command, press Enter (or click Run), and it is
dispatched through the exact same parser as Flixel.debug.executeCommand(...), so anything you can type here you
can also trigger from code. Press the Up / Down arrows to walk back through your recent commands.
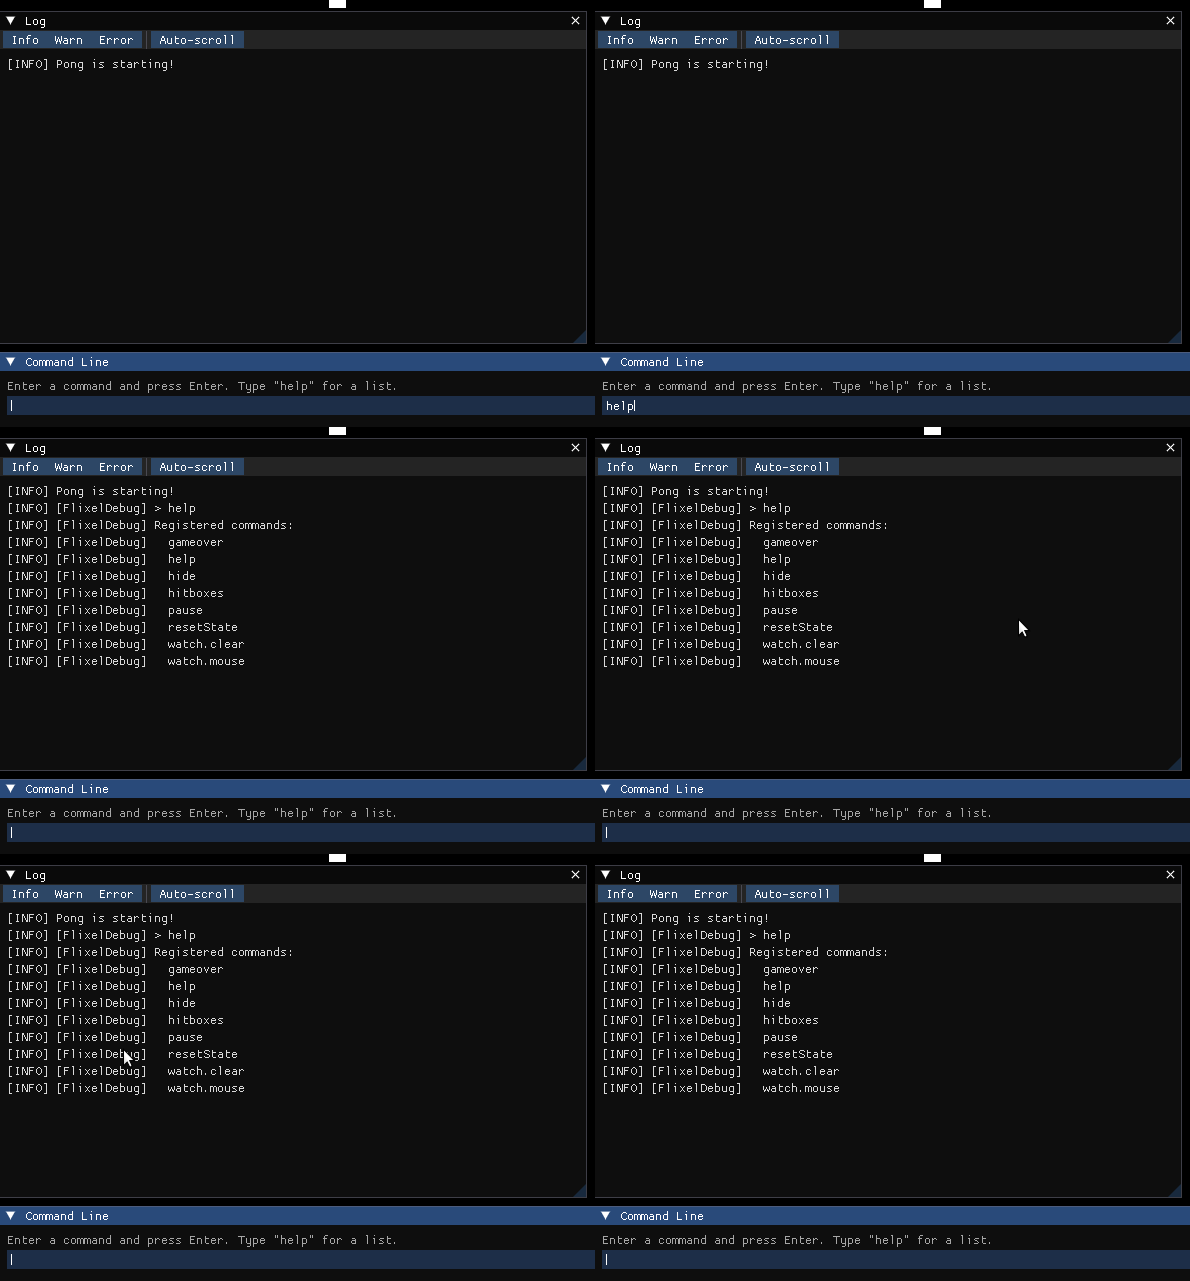
Built-in commands:
| Command | What it does |
|---|---|
help [filter] | Lists all registered commands; pass a prefix to show only matching names. |
pause [true/false] | Pauses or unpauses the game loop (toggles if no argument is given). |
hitboxes [true/false] | Toggles hitbox drawing (toggles if no argument is given). |
hide | Hides the overlay. |
resetState | Destroys and re-creates the current state from scratch. |
watch.clear | Removes all watch entries. |
watch.mouse | Adds the mouse X/Y watch entry. |
Keybinds
These are the default debug controls:
| Action | Default |
|---|---|
| Toggle overlay visibility | F2 |
| Toggle hitbox drawing | F3 |
| Pause / unpause game loop | F4 |
| Pan camera (while paused) | Right mouse drag |
| Cycle camera left (while paused) | Alt + Left arrow |
| Cycle camera right (while paused) | Alt + Right arrow |
| Zoom inspected camera (while paused) | Mouse wheel |
| Inspect / drag a sprite (while paused) | Left mouse |
You can read the current bindings at runtime through the matching getters on Flixel — for example
Flixel.getDebugToggleKey(), Flixel.getDebugPauseKey(), and Flixel.getDebugCameraPanButton(). These return the
int key/button codes (the same constants exposed by FlixelKey, which wraps libGDX's Input.Keys), which is
handy if you want to display the active keys on your own help screen. The Controls window already lists them all
live for you.
While paused
When the game loop is paused (F4), several additional mouse interactions become available:
- Scroll wheel — zooms the currently selected camera in and out.
- Right mouse button drag — pans the camera in world space.
- Left click on a sprite — selects it for the Texture Inspector and enables dragging.
- Left mouse button drag (after clicking a sprite) — moves the sprite in world space.
- Alt + Left / Right arrow — cycles between cameras when your game has more than one.
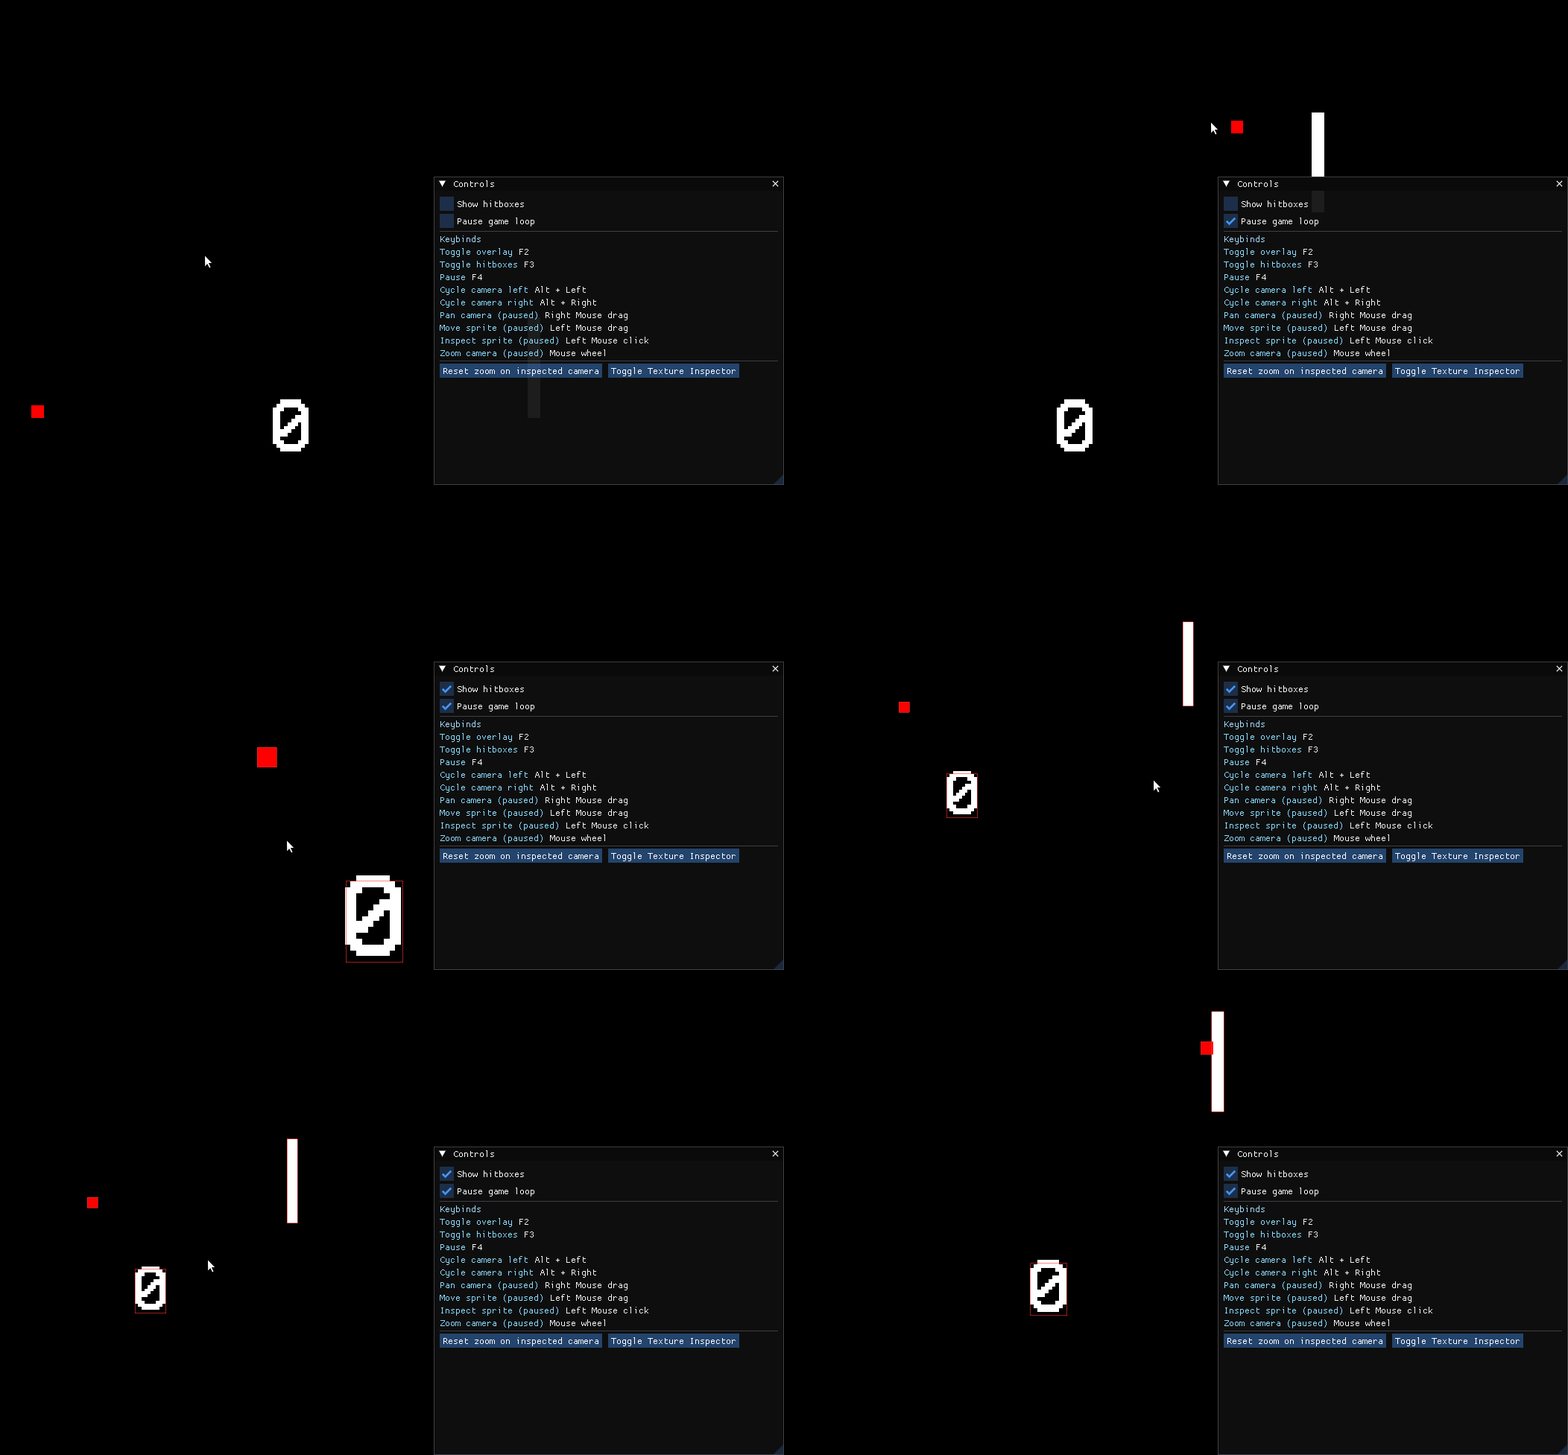
Camera positions and zoom levels are automatically restored when you unpause, so your inspection session never changes the real game state.
Controlling the overlay from code
Flixel.debug exposes the full FlixelDebugManager API. You can use it to show/hide the overlay,
toggle hitbox drawing, and manage commands from anywhere in your game code:
- Java
- Kotlin
Flixel.debug.setVisible(true);   // show the overlay
Flixel.debug.toggleVisible();    // flip visibility
Flixel.debug.setDrawDebug(true); // enable hitbox drawing
Flixel.debug.toggleDrawDebug();  // flip hitbox drawing

// Execute a command programmatically (works even without the UI).
Flixel.debug.executeCommand("resetState");
Flixel.debug.isVisible = true   // show the overlay
Flixel.debug.toggleVisible()    // flip visibility
Flixel.debug.isDrawDebug = true // enable hitbox drawing
Flixel.debug.toggleDrawDebug()  // flip hitbox drawing

// Execute a command programmatically (works even without the UI).
Flixel.debug.executeCommand("resetState")
Creating your own commands
Register a command with a name and a handler that receives a FlixelDebugCommandArgs object. The args
object wraps the whitespace-separated tokens the user typed after the command name.
Command names may only contain ASCII letters and periods (e.g. spawn, ai.toggle, scene.reload).
- Java
- Kotlin
// Register during create() or in the constructor of your game.
Flixel.debug.registerCommand("spawn", args -> {
  String type = args.getString(0, "enemy");  // first arg, default "enemy"
  int count = args.getInt(1, 1);             // second arg, default 1
  for (int i = 0; i < count; i++) {
    spawnEnemy(type);
  }
  Flixel.info("Spawner", "Spawned " + count + " " + type);
});

// To remove a command later:
Flixel.debug.unregisterCommand("spawn");
// Register during create() or in the constructor of your game.
Flixel.debug.registerCommand("spawn") { args ->
  val type = args.getString(0, "enemy")  // first arg, default "enemy"
  val count = args.getInt(1, 1)          // second arg, default 1
  repeat(count) {
    spawnEnemy(type)
  }
  Flixel.info("Spawner", "Spawned $count $type")
}

// To remove a command later:
Flixel.debug.unregisterCommand("spawn")
You can then type spawn boss 3 in the command window to call the handler with args[0] = "boss" and
args[1] = "3". The FlixelDebugCommandArgs helpers (getString, getInt, getFloat, getBoolean)
parse and return the argument at the given index, or a default value when the argument is absent.
Common debugging scenarios
"My sprite is in the wrong place"
- Pause the game (F4).
- Left-click the sprite in the window to select it.
- Check the Watch panel — add the sprite's
x,y,width,heightto confirm what the code thinks. - Toggle hitboxes (F3) to see the bounding box vs. the visual position.
"I'm getting a lag spike every few seconds"
Open the Performance window and watch the Frame (ms) graph for tall spikes appearing at a regular interval. If those spikes line up with sawtooth drops on the Heap (MB) graph, the garbage collector is the culprit. Common causes:
- GC pressure from allocating objects every frame (look for
Array,HashMap, ornew Vector2(...)construction inupdate). Prefer libGDX collections likeObjectMap/IntSetand reuse a single scratch instance. - A texture that is loaded (and uploaded to the GPU) inside the game loop rather than in a loading state.
"The overlay is blocking my input / game controls"
The overlay captures keyboard and mouse input only while it is focused. If you click inside an ImGui window the text box may hold keyboard focus. Press Escape or click outside the overlay to return focus to your game. Function keys (F2, F3, F4) always pass through to the debug layer regardless of focus.
"I want to show debugging information in a release build without the full overlay"
Use Flixel.info / Flixel.warn / Flixel.error with your own FlixelLogger listener. In release mode
the overlay is absent but the logger still dispatches events to every registered listener, so you can
forward to a file or an in-game console of your own design.
"I want to test a specific state immediately on startup"
Use a reset command combined with a switchState call:
- Java
- Kotlin
Flixel.debug.registerCommand("goto.battle", args -> Flixel.switchState(new BattleState()));
Flixel.debug.registerCommand("goto.battle") { args -> Flixel.switchState(BattleState()) }
Then type goto.battle in the command line whenever you want to jump straight to the battle state from
any other state without clicking through menus.